Sellers opened at the high and never let go — the question for Friday is whether a 419-point slide leaves room for anything but a pause before the next leg.
EXECUTIVE SUMMARY
- Every long-term gauge points down: the market is trading under all its major averages, and value has stepped lower week over week.
- Thursday was a one-way Trend Down day (a day where one side controls from open to close), a 419-point range that closed near the low.
- Primary plan for Friday: lean on 22270 as the make-or-break level; below it, selling resumes, while a recovery above it invites a corrective rotation.
MACRO CONTEXT
The weekly picture is firmly bearish: this week’s value zone (22520–22830) sits well below the prior week’s (23140–23480), and each week has opened lower than the last. Price (22232) now sits in the bottom tenth of the big two-year balance zone that runs from 21744 to 26373, a region where buyers have historically shown up. Thursday’s selling was with the trend, not against it. Short-term and long-term averages are stacked in descending order, so rallies are being sold until proven otherwise.
Who Controlled the Day
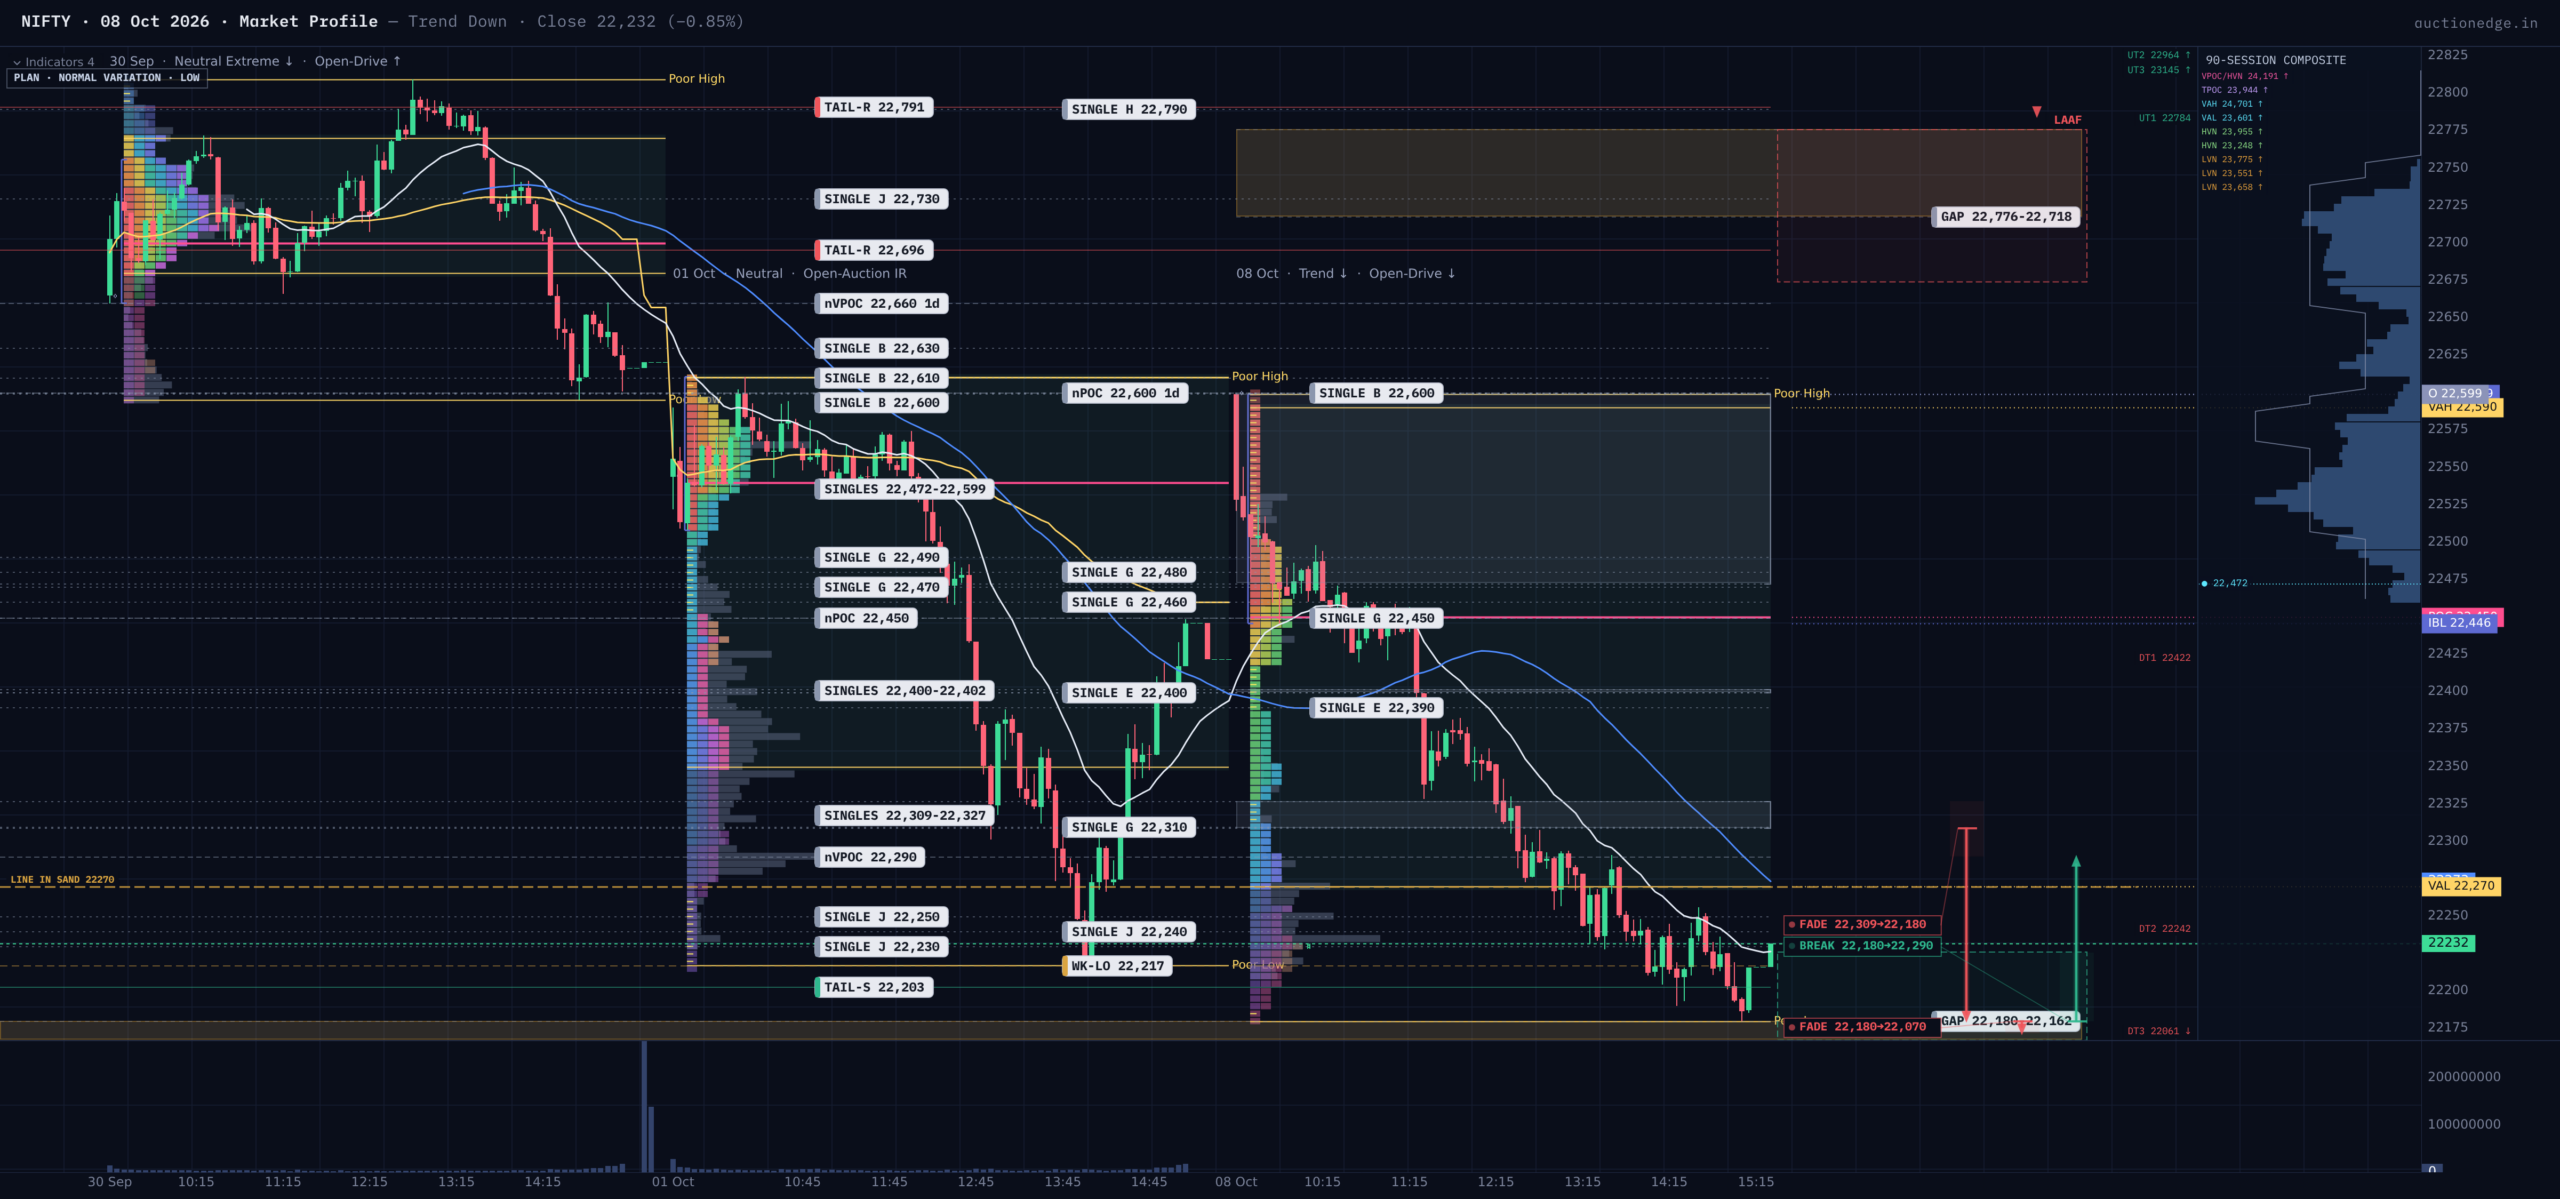
The market opened with an “open-drive” lower (an aggressive push away from the open with no looking back), starting at 22599 — the high of the day — and a 100-point rejection tail formed within the first half-hour. That is initiative selling: longer-term sellers acting proactively rather than reacting to price. They broke below the first hour’s range (the Initial Balance, 22599–22446) in just the third half-hour, which signals high conviction rather than a late liquidation.
Value then migrated lower in a clean sequence. By volume, the zone holding most of the day’s trade (22270–22470) sits entirely beneath Wednesday’s (22610–22680), so there was no overlap and no acceptance back at higher prices. Wednesday was a two-humped session that closed lower; Thursday took that weakness and extended it, which is what a trend day looks like: sellers kept adding every time price paused. The close at 22232, within the lowest 12% of the range, tells us they were still in control at the bell.
Anchored fair-value lines confirm the sequence: Thursday’s average price (22391) sits below Wednesday’s (22672), which sits below Tuesday’s (22763), a falling staircase. The week-to-date line (22596) is overhead and now acts as a distant ceiling.
Where Volume Traded vs. the Close
Time and volume disagree. The most-visited price by time was 22450, but the heaviest volume traded at 22290, 160 points lower. Price closed beneath both, so late sellers were not hesitant and the 22290 volume cluster is now unfinished business above the market, a likely pull on any bounce.
Volatility Cross-Check
Thursday’s move was roughly a 2-sigma event (about a 1-in-20 day), and recent swings are running well above what options priced in, so range expansion rather than quiet drift remains the working assumption.
Reference Levels That Matter
Buyers defended 22180–22226 late in the day, a fresh buying tail (a zone where price was quickly rejected on the way down) just beneath the close. Above, the first obstacles are the thin, low-participation prints at 22309–22327, then the 22290 volume cluster, and then 22450 and the 100-point selling tail at 22472–22599. The 8-day balance floor is today’s low, 22180, and the next large buying zone is 22022–21744 (an old April 2025 low), with a long-untested volume cluster at 22070 along the way.
Historical Lean
Moderate evidence points to a bounce: after a Trend Down day with an open-drive lower, the next session closed higher 59% of the time (39 cases), and after similar 2-sigma moves 58% (38 cases). The edge is modest, not decisive, and clashes with the bearish structure. Treat it as a reason to expect a corrective rotation, not a reversal.
Opening Playbook (Friday)
- Inside value (22270–22590): Expect a rotation toward the thin prints at 22309–22327 and the 22290 volume cluster. Sellers who defend these levels offer the best location; entry 22290–22327, stop above 22352, first target the 22180 low.
- Below value, inside range (22180–22270): Buyers must hold the new tail. A hold above 22180 followed by acceptance back above 22270 targets 22290. Low confidence, because it fights the trend.
- Above value, inside range (22590–22599): A thin sliver. A move there runs into the 22472–22599 selling tail; fade it with a stop above 22670.
- Below the range (under 22180): Trade with the gap. A break and acceptance under 22180 aims at the 22070 untested volume cluster; stop back inside above 22226.
- Above the range (over 22599): Trap warning. A gap up of this size would run straight into the overhead selling tail and Wednesday’s 22674–22718 rejection; fade it, with an exit if price holds above 22718.
Game Plan / Bottom Line
Friday opens with sellers firmly in charge on the higher timeframes but with today’s late-session buying tail underneath. The most probable path is a bounce into 22290–22327 followed by a decision: failure there keeps the auction pointing at 22180 and then 22070, while acceptance above 22270 and then 22352 would tell us the slide has run out of sellers for now.
Line in the Sand & Key Levels
LINE IN THE SAND: 22270. Above 22270, bias turns to a corrective bounce; below it, bias stays lower.
– 22599 | Day high / selling tail top | Sellers’ starting point
– 22450 | Time-based center of value | Bounce ceiling
– 22290 | Volume cluster, unfinished | Magnet and sell location
– 22270 | Value area low | Make-or-break
– 22180 | Day low / buying tail base | Last defense
– 22070 | Long-untested volume cluster | Next downside target
Session Learning Note
When a market opens at its extreme and a rejection tail forms in the first half-hour, the day is rarely a balance day, and volume left behind at lower prices is the cleanest guide to where the first bounce stalls.