The question coming out of Monday was whether the gap-up open would hold or whether last week’s sellers were simply waiting for a better price. The close answered it: the gap was sold, filled and then some.
EXECUTIVE SUMMARY
- Every timeframe we track still points down, and value (the zone holding about 70% of a day’s trade) has stepped lower three sessions running.
- Monday opened 73 points higher, was rejected near 22651 and closed at 22363, near the low: a long-liquidation break rather than a fresh trend.
- Tomorrow’s line in the sand is 22310: hold it and the market rotates inside value; lose it, with the 22295 buying zone failing, and the selling extends.
MACRO CONTEXT
The weekly picture is lower: this week’s value sits below last week’s, and weekly trade has now stepped down two weeks in a row. Price sits in the lower quarter of the very large multi-year balance, testing a long-standing floor. All of the longer averages are stacked in bearish order, so Monday’s sell-off was with the trend, not against it. Against that, the nearer two-week balance has not broken, so this is a market leaning down inside a range rather than one in free fall.
Who Controlled the Day
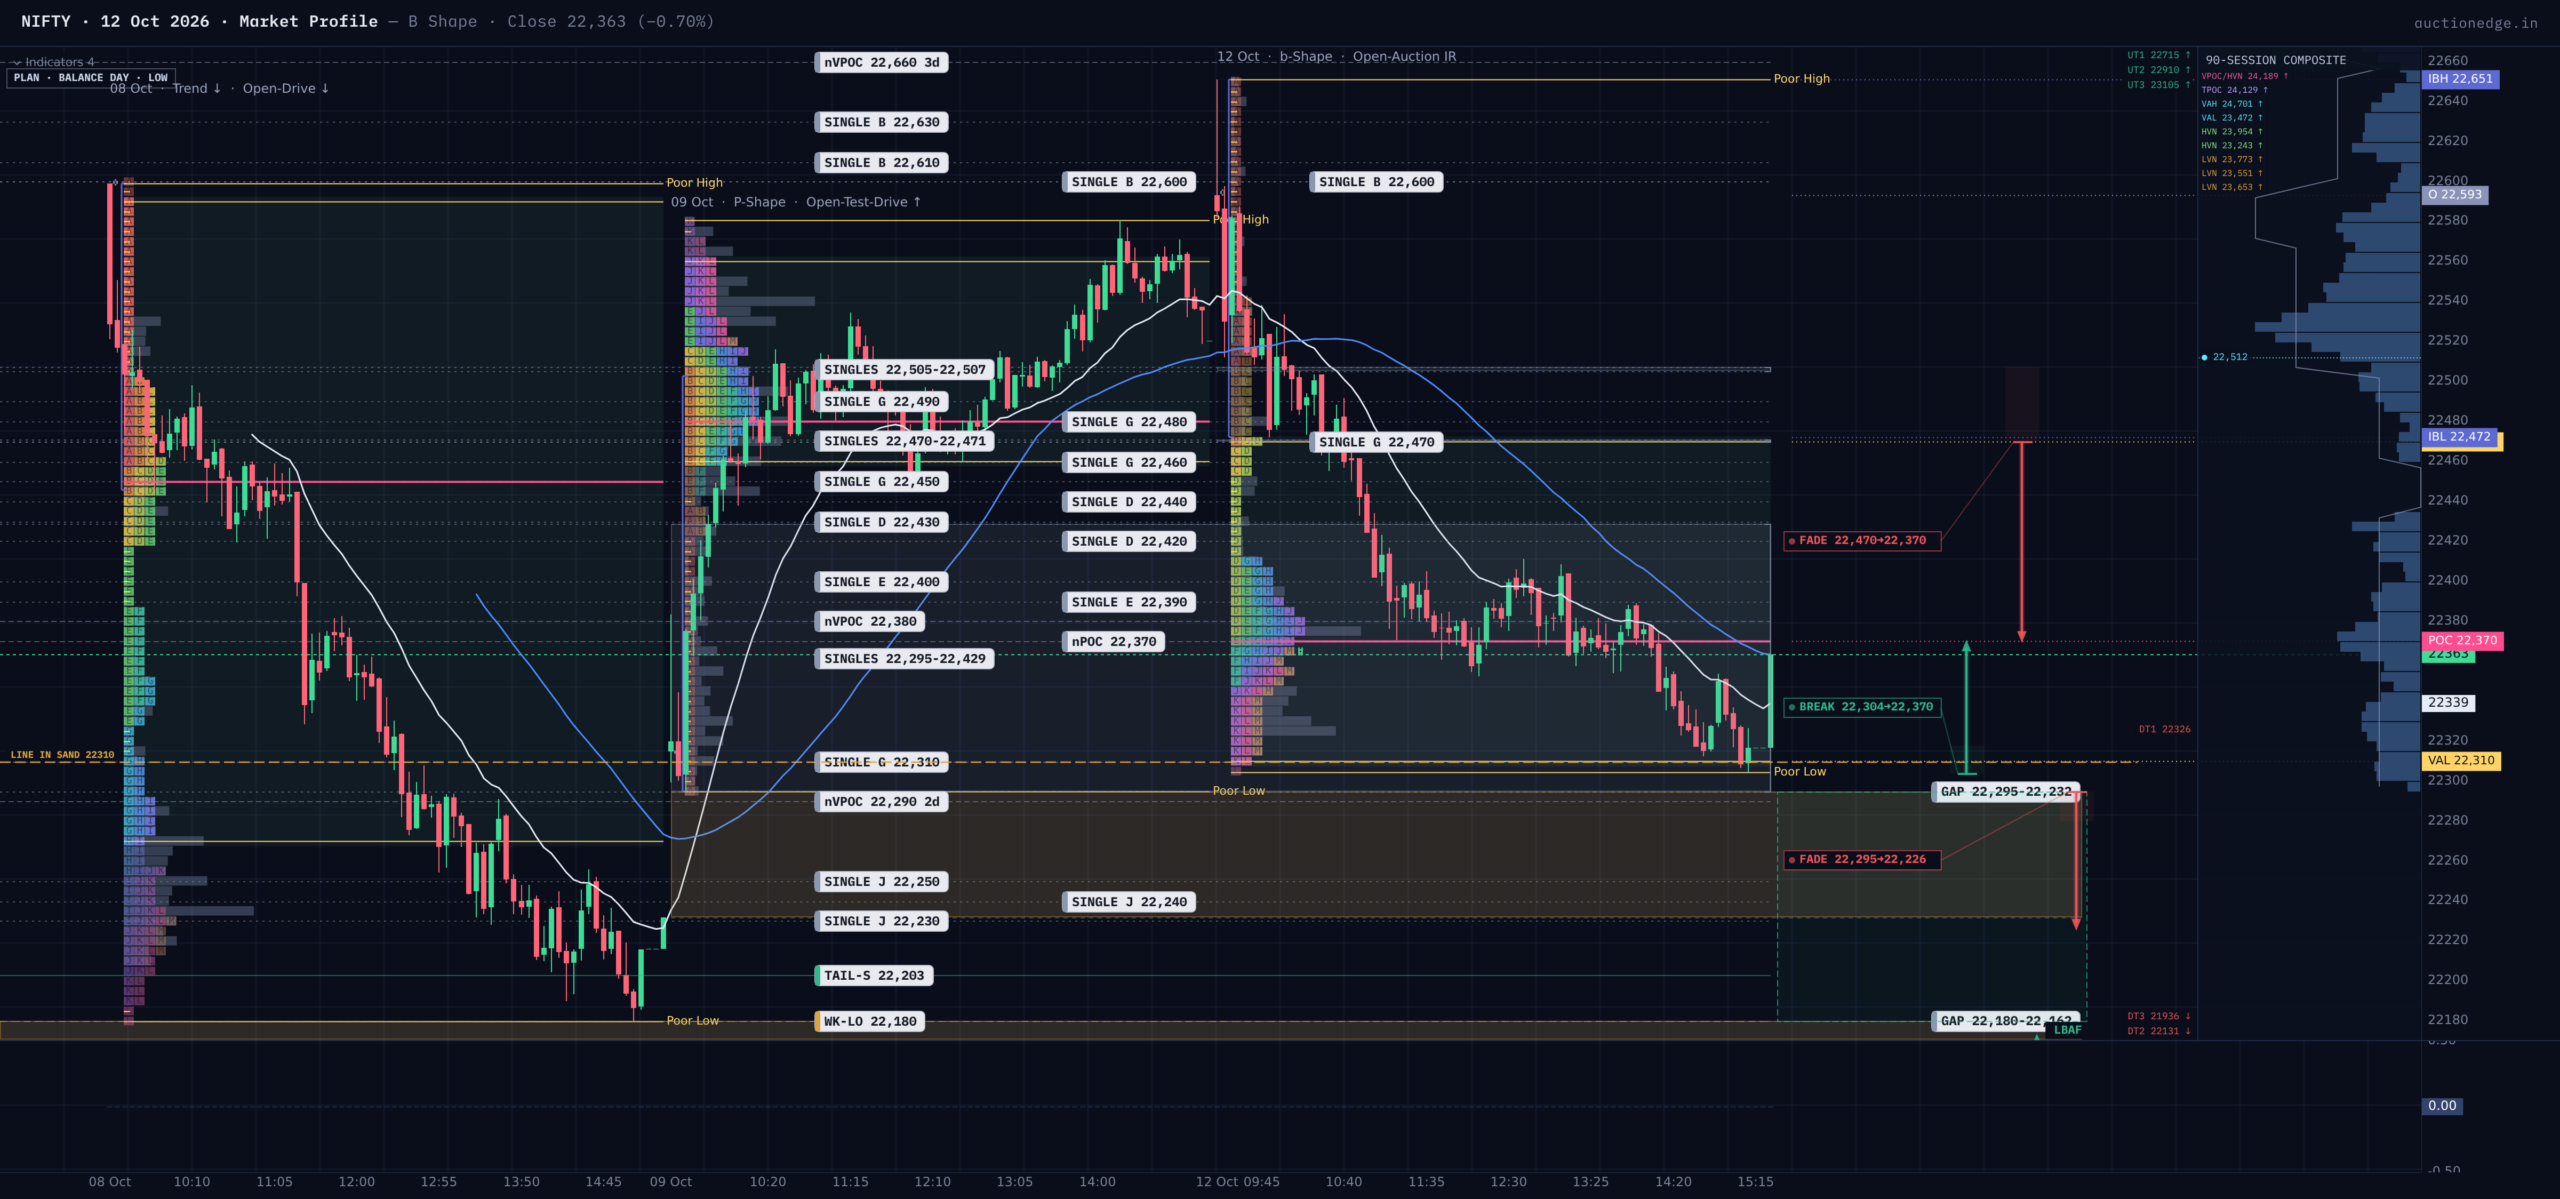
Monday was a B-shaped day (a long-liquidation break: bulk of trade concentrated low, thin tail above). The market opened at 22593, above Friday’s close but inside Friday’s range, and sellers capped it almost at once with a selling tail (prices buyers rejected quickly) running from 22651 down to 22512. The first hour’s range (the Initial Balance) was 22651 to 22472, and it broke lower in the second hour. An early break like that signals real conviction: longer-horizon sellers were initiating, not just fading.
The auction logic matters here. Gap-up buyers were trapped above value, and as they exited the market had to find who would absorb the selling. Nobody did until the 22380 zone, where the afternoon spent hours rotating. The day’s range of 347 points was 1.33 times the 20-day average, a genuine expansion on a day that never closed above its lower quarter, finishing at 17% of the range.
Value moved from 22460–22560 on Friday to 22310–22470 today, essentially non-overlapping, with the most-traded price at 22370 and the volume-heaviest price at 22380. Those agree, so there is no hidden time-versus-volume divergence; both say fair price was accepted lower. The close, just below the most-traded price, shows no short-covering bid into the bell.
Our anchored VWAPs (volume-weighted averages tied to single sessions) are mixed rather than cleanly stacked: today’s 22478 is below Friday’s 22540 but above the day before’s 22391, which reads as transition. The close sits roughly 115 points under the weekly VWAP of 22478, a level that now acts as a ceiling for any recovery. The slower rolling averages remain in bearish order as backdrop.
Reference Levels That Matter Tomorrow
Below price, a buying tail from Friday at 22295–22304 sits only two points from the close and is already partly filled; a second one at 22180–22226 lies beneath. An untested high-volume price from last Thursday at 22290 sits in the same neighbourhood, so 22290–22304 is a stacked cluster where responsive buyers have a case. Above price, thin single prints (areas the market moved through quickly) at 22470 and 22505–22507 mark the first obstacles, followed by today’s selling tail and a small unfilled gap at 22581–22593. The two-week balance floor at 22180 is the active boundary; price is inside it and has not broken.
Options pricing implies about 16% volatility while the last five days have realized nearly 20%, so the options market is underpricing recent movement. Treat that as a reason to respect stop distances, not as direction.
Historical analogs offer only a slight lean: after a similar day, 55% of 20 comparable sessions rose the next day, and a narrower 14-session match rose 64%. Neither is a real edge, and the broader sample is near a coin flip.
Opening Playbook
- Inside value (22310–22470): Expect rotation around 22370–22380. Fade the edges toward the middle; the mid-value area is a poor place to start a trade.
- Between the low and value (22304–22310): A thin slice, and it sits on the buying tail. Responsive longs target 22370 and are wrong on acceptance under 22295.
- Between value and the high (22470–22651): This runs into the single prints and selling tail. Trap warning: a rally here is a recovery into trapped supply, and rejection back below 22470 favours a fade toward 22370.
- Below the range (under 22304): First stop is the 22295 tail, then 22226. Acceptance below 22295 would extend the break toward 22180–22226.
- Above the range (over 22651): Unlikely, and it faces the 22674–22718 selling tail. Trap warning: a gap there is a fade candidate back toward the 22581–22593 gap.
Bottom Line
The primary expectation is a test of the 22295–22310 area first. A hold turns the day into rotation inside Monday’s value, with the weekly VWAP and 22470 capping bounces. Roughly 40% continuation lower, 35% balance rotation, 25% recovery, held with low conviction because the structure is bearish while the statistics are neutral.
LINE IN THE SAND: 22310. Above it, rotation and a bounce toward 22470; below it, with 22295 failing, the break extends.
KEY LEVELS (high to low):
– 22651 | Day high / selling tail top | Sellers rejected the gap here
– 22505–22507 | Single prints | Fast-move zone overhead
– 22478 | Weekly VWAP | Ceiling for any recovery
– 22470 | VAH / single print | First hurdle back into the prior zone
– 22380 / 22370 | Volume POC / TPO POC | Where the market was accepted
– 22310 | VAL | Line in the sand
– 22295–22304 | Buying tail (Friday) | First responsive zone
– 22180–22226 | Buying tail (Thursday) | Next floor
Session Learning Note
A gap that opens inside the prior range is not initiative buying; when sellers cap it in the first hour, the fill is usually the beginning of the move, not the end.