Wednesday’s question was whether the morning’s push higher could hold once the sellers showed up. It could not: the market spent the afternoon handing back every point of the opening drive and closed within a whisker of the low.
EXECUTIVE SUMMARY
- Every trend gauge we track points down, and NIFTY sits in the lower quarter of its two-year range, so rallies are fighting the tide.
- Tuesday was a P-shaped day (a short-covering rally that stalled); Wednesday erased its gains and closed under the fair-price zone.
- Primary plan: sell weakness while price stays below 22680; a recovery through that line, held, turns the day into a rotation back toward 22700.
MACRO CONTEXT
The bigger picture is one-directional. Our composite market read is at its most bearish setting, and the moving averages have crossed into a death cross (the 50-day average falling below the 200-day). Fair-price zones have stepped lower on three of the last four days, and last week’s weekly zone (23140 to 23480) now sits far above price. NIFTY is trading at roughly 19% of its 820-day range, testing the lower quarter. Tuesday’s rally was a counter-trend bounce inside that decline, and Wednesday’s close says the bounce is finished.
Who Controlled the Day
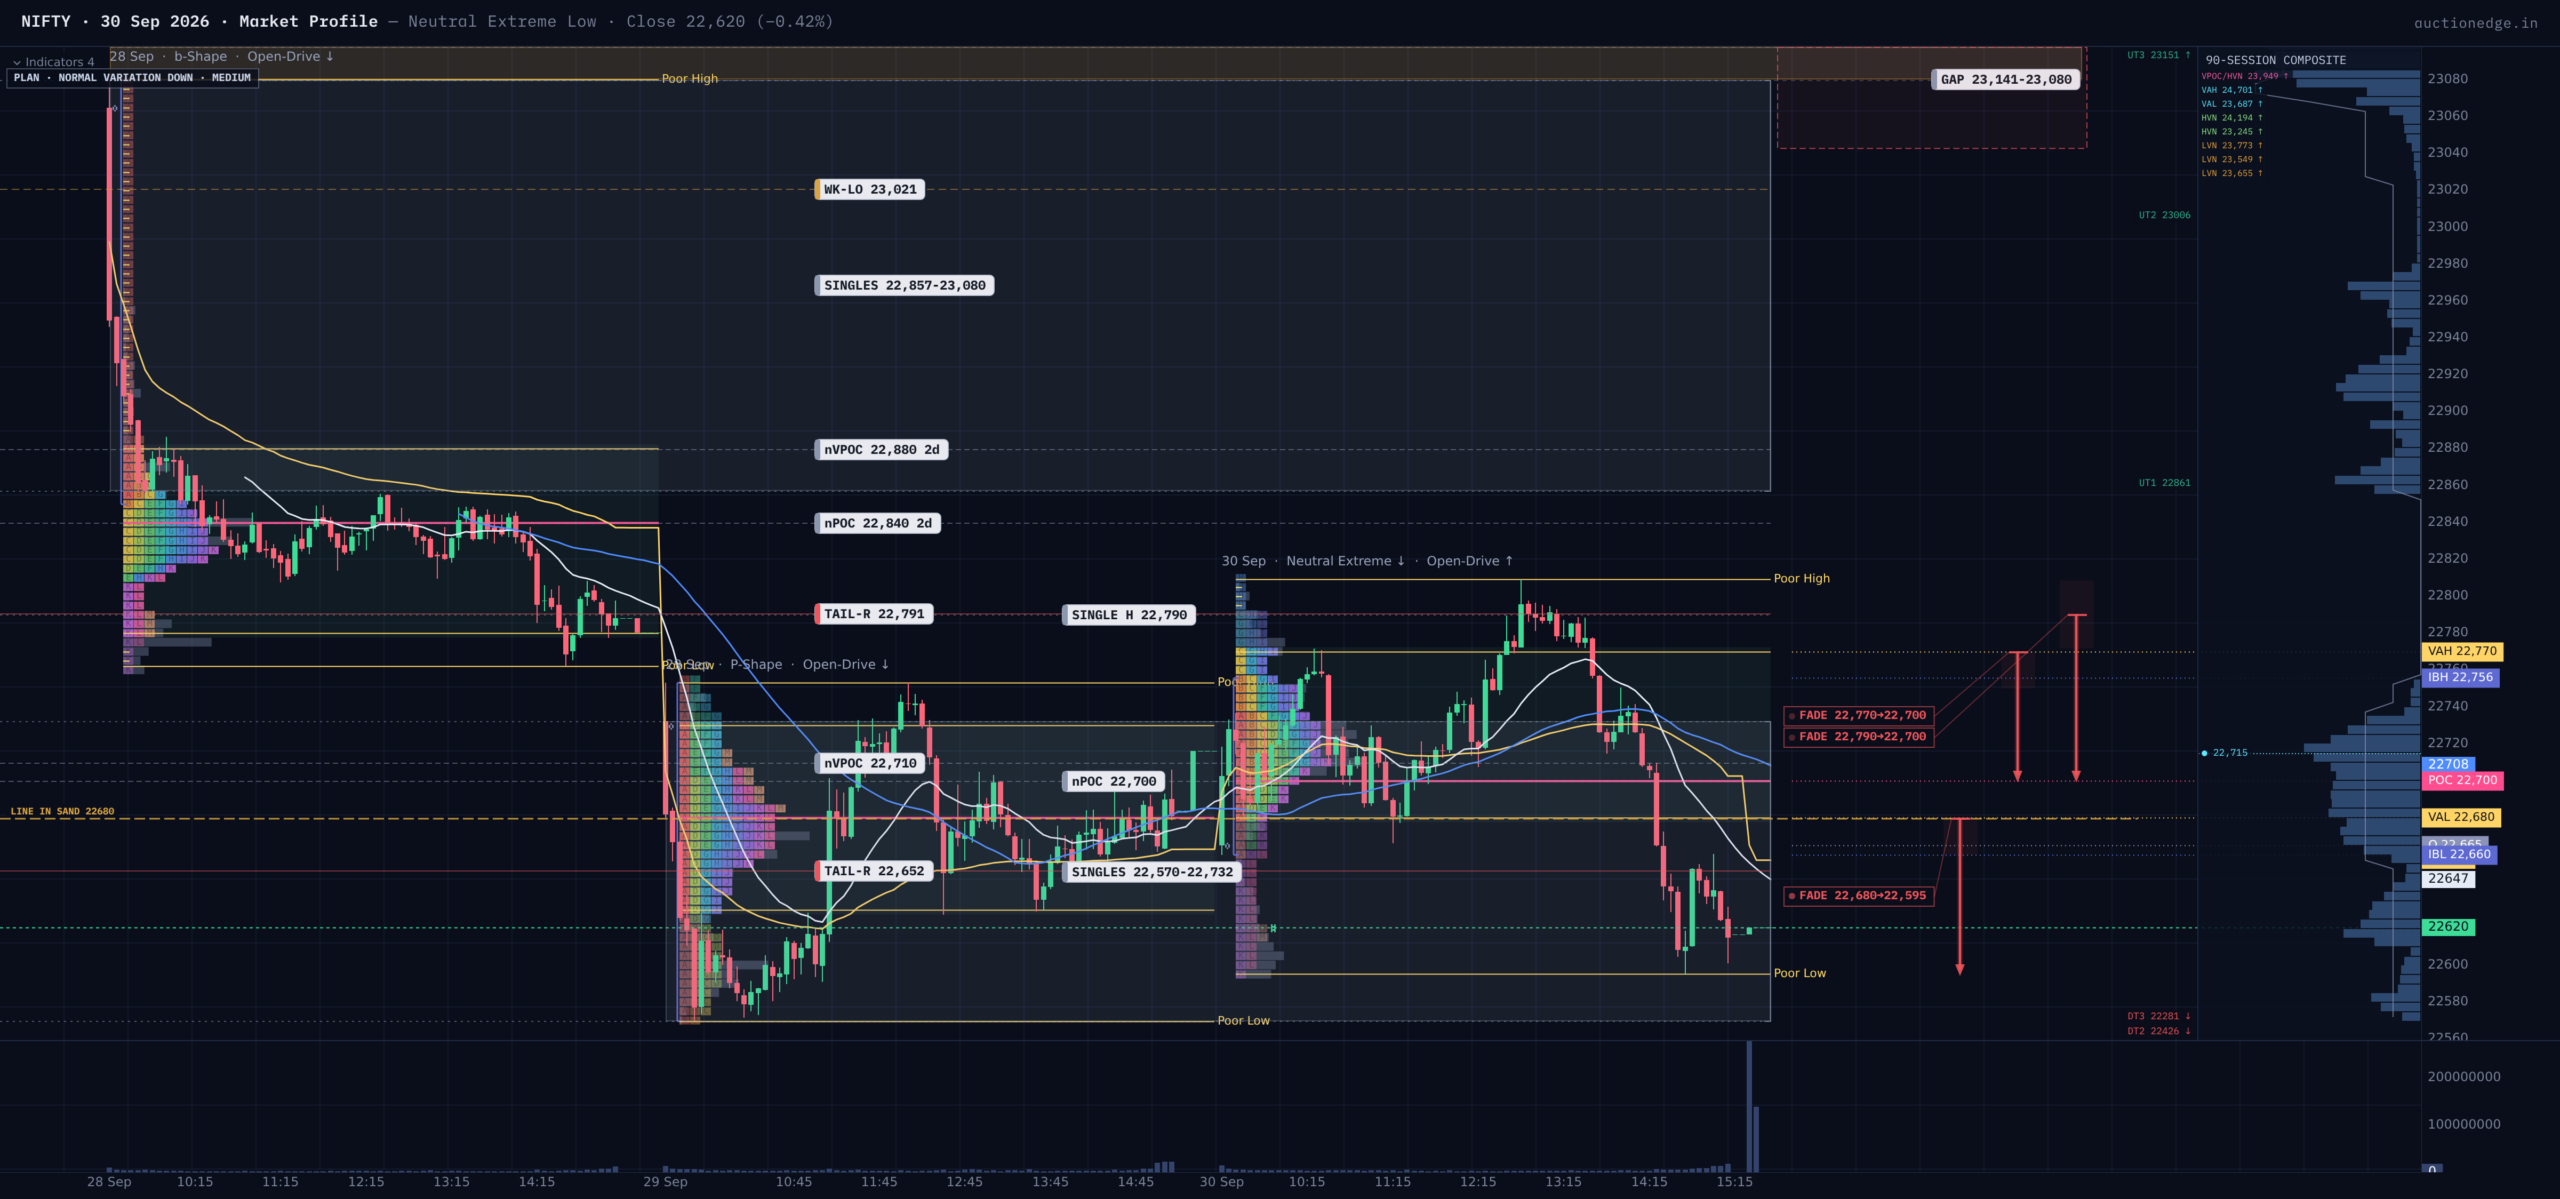
NIFTY gapped down 51 points, then opened with a sharp drive up (an aggressive one-way move away from the open). The drive stalled near 22809, leaving a thin selling tail (a zone of rejected prices) at 22772 to 22809, and follow-through buyers never arrived. Instead the day became a Neutral-Extreme day closing low: both sides of the first hour’s range (22660 to 22756) were broken, which shows two-way trade, but the last word belonged to sellers. The close sat at 22620, about 12% up from the low, under the fair-price zone.
The timing matters: the downside break only arrived in the 2:15 pm half-hour, which reads as longer-horizon holders selling into the close rather than day traders squaring up. A lower-extreme close makes a lower open the more likely start tomorrow.
Value (the zone holding about 70% of the day’s trade) shifted only modestly. It ran 22680 to 22770 against Tuesday’s 22630 to 22730, so the two overlap while edging higher, yet the close finished below the bottom of it. That mismatch is the tell: the market advertised higher prices in the morning and refused to accept them by afternoon. Just overhead sit two naked POCs (high-volume prices not yet retested) at 22700 and 22710, which may pull price up on any rebound.
The Anchored Averages
Today’s volume-weighted average price sat at 22808, above Tuesday’s 22671 but below the 22881 of two days ago, which is a mixed, transitional ordering. The week-to-date average at 22780 is the key intermediate pivot: close below it means defensive tape. They are not squeezed together, so no coiled breakout is signalled; the long-run rolling averages are stacked bearishly.
Volatility, Balance and Levels
Today’s 214-point range matched the 20-day average of 210, a modest 0.66-sigma event; intraday swings run about 30% above what options imply, yet options look fairly priced against recent realized moves.
On the balance front, the nine-day range from 15 to 23 September broke lower on Tuesday, and the measured-move target for that break is 22163. The two-day balance formed since Tuesday (22570 to 22809) has price at its lower edge. Reference levels below start at the buying tail (a zone where buyers stepped in) at 22570 to 22595, already partly filled, then 22543 to 22555. Above, the first cap is the selling tail at 22772 to 22809, then 22857 and higher. Naked POCs lie above at 22840 and 22880, and far below at 22340.
What History Says
Analog samples give only a faint lean lower, not an edge. After Wednesday sessions like this one the next day fell 60% of the time (n=20), and the closest open-plus-day-type match fell 53% (n=15).
Tomorrow’s Playbook
Roughly, I weight continuation lower at 50%, a rotation back into value at 35%, and a squeeze higher at 15%.
- Open inside value (22680 to 22770): Sentiment is unchanged. Fade the edges, aiming for the 22700 area, and wait for the first hour to set the range.
- Open below value, inside the range (22595 to 22680): The first sellers’ target is the day low. A rally into 22680 that fails is the entry; acceptance back above 22710 cancels it.
- Open above value, inside the range (22770 to 22809): This runs straight into the selling tail. Trap warning: a push here has to clear supply at 22809 with almost no room, so fade it, with a stop above 22810.
- Open below the range (under 22595): A gap into the partly filled buying tail. Expect a first pause near 22543 to 22555; if price gets rejected back inside the range, buyers get a responsive trade back toward 22680.
- Open above the range (over 22809): Trap warning: overhead sit the 22840 naked POC and the heavy selling tail from 22857. A gap up is a fade candidate unless price is accepted above 22880.
Game Plan
The easier direction is lower: lean short on failed rallies below 22680 and expect the day-low area to be tested first.
Line in the Sand: 22680. Above it (and holding), the day is a rotation toward 22700 and 22710. Below it, sellers keep control.
Key Levels
- 22880 | Naked POC | Acceptance above cancels the bearish bias
- 22857 to 23080 | Selling tail | Heavy overhead supply
- 22809 | Day high | Thin selling tail sits below it
- 22772 | Selling tail base | First cap on a rally
- 22710 / 22700 | Naked POCs | Magnet above the close
- 22680 | Value area low | Make-or-break line
- 22595 | Day low / buying tail | First downside test
- 22543 | Old buying tail | Second downside pause
- 22163 | Balance-break target | Measured move if the low gives way
Session Learning Note
A strong open is only as good as the follow-through: when an opening drive fails to build a value area above the prior day’s, the market is telling you the buyers were short-covering, not initiating.