Friday looked constructive into the close — buyers seemingly back in charge. Monday erased that in one session: a gap down, a wide opening range that gave way by mid-morning, and a close pinned at the low answered who controls this tape.
EXECUTIVE SUMMARY
- The bigger picture stays uniformly bearish — VWAP, EMA and moving-average stacks all aligned down, market breadth weak, daily value migrating lower for a fourth session.
- Friday’s strong-high close proved a false signal: today gapped down, broke a wide Initial Balance, and closed at the low in a 2.43-sigma “B-Shape” breakdown.
- Tomorrow is NIFTY’s weekly expiry with dealer positioning turning stabilizing into the close — watch 22,880/22,780 as the pivot, but expect pin risk to blunt an early breakout.
MACRO CONTEXT
Every moving-average lens points the same way: the 5/30/90/250-day VWAP stack and the EMA stack are both “perfect bear,” and the 50/200-day cross confirmed a death cross. Breadth confirms it isn’t just the index — only 10.9% of stocks sit above their 50-day average, just 1.8% carry a fully bullish alignment versus 30.9% fully bearish. Daily value areas have moved lower in three of the last four sessions; today’s fully non-overlapping shift beneath Friday’s value extends that run to four. Weekly value, though, still overlaps the prior week’s — this remains a grinding downtrend, not yet a weekly capitulation.
What Kind of Day This Was
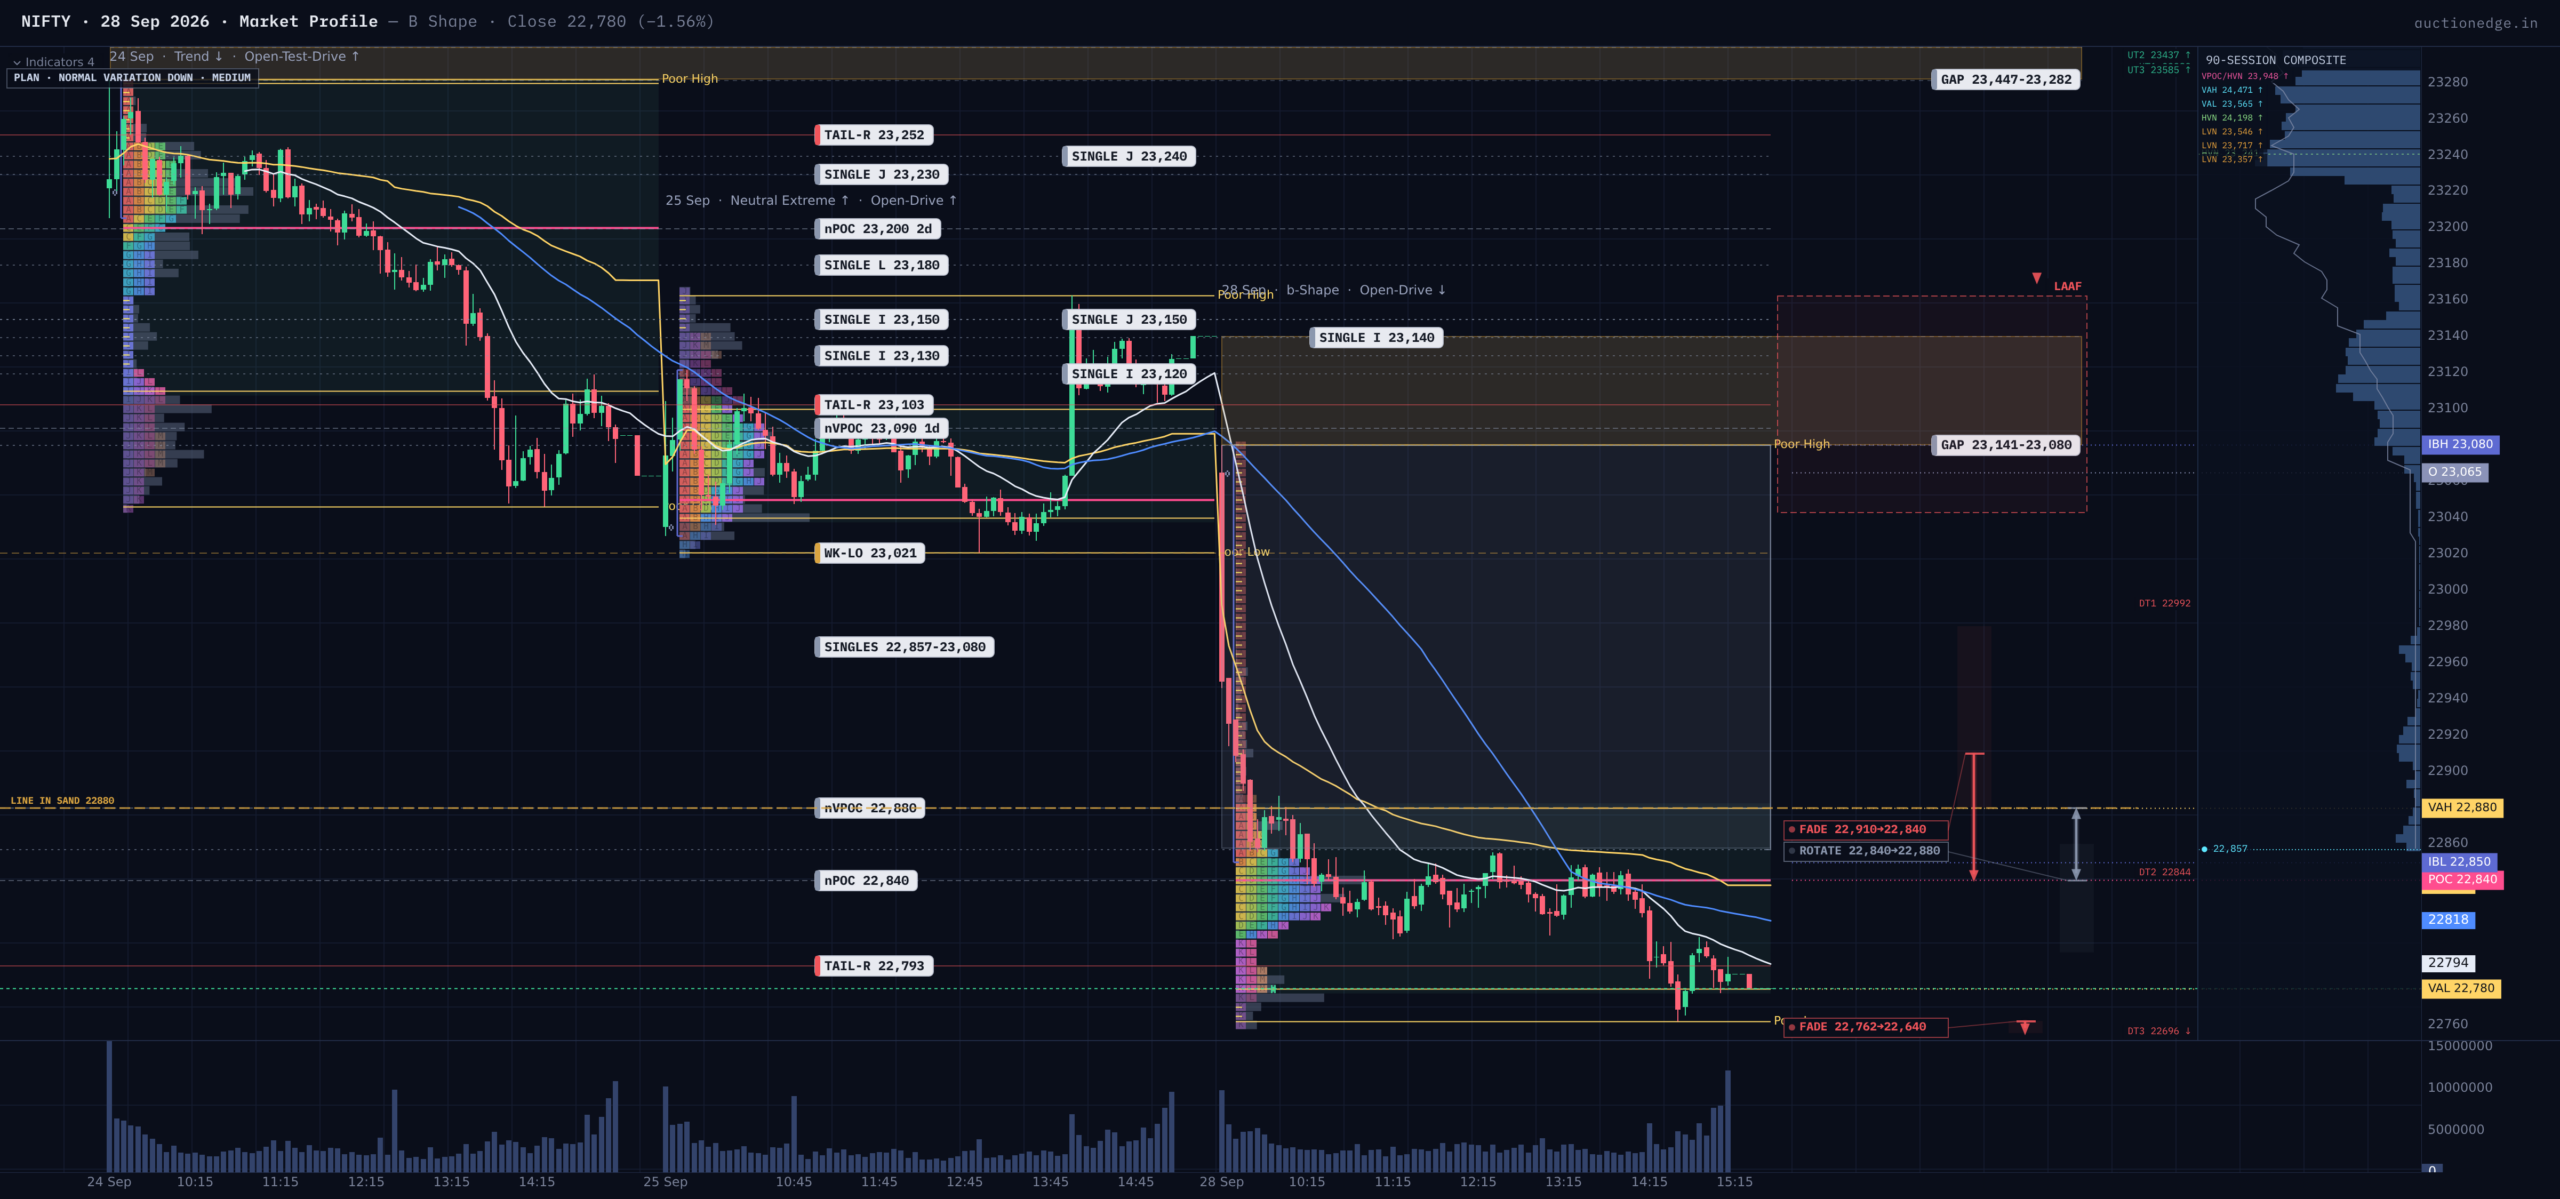
Today is a B-Shape day (a long-liquidation break: trade concentrated low in the range, a thin sliver up top) on an Open-Drive Down (immediate, sustained selling from the bell, no meaningful bounce back through the open). The open sat inside a modest 76-point gap down (0.33%), but what mattered more: the Initial Balance — at 230 points, actually a touch wider than the 20-day average true range (208 points), ordinarily a “strong base” — gave way anyway, breached to the downside in the third half-hour period. A wide base breaking that early is a higher-conviction tell than a narrow one failing. The close came in the bottom 5.7% of a 318-point range (56% above the 5-day average) — a 2.43-sigma move, the kind seen roughly once every twenty sessions.
Where Value Moved — and Who Pushed It
Today’s value area (22,780-22,880) sits entirely beneath Friday’s (23,040-23,100) with zero overlap — clean downward migration, sellers resetting fair price rather than just probing there. A firm selling tail formed at the top (193 points of rejection through 22,857-23,080), showing sellers actively defended the highs; the low, by contrast, closed with no offsetting rejection — an undefended floor, not yet a completed auction. The close landed right at today’s value low and just under the volume-based value low (22,820) — fair price’s own edge, no cushion left. One caution: the system’s longer-run “who’s in control” read stayed neutral despite the size of the move — today’s drama was fast and concentrated, not a slow one-timeframe grind.
Volatility Check
Realized volatility is accelerating faster than options price it (5-day HV 16.2 vs. 20-day 10.2, IV a fair 16.3), and today’s 2.43-sigma range argues for roughly 1.6x wider stops/targets than normal — worth remembering into tomorrow’s weekly expiry, where dealer gamma flipped short-to-long into today’s close, a pin-prone setup that argues against chasing an early breakout.
Balance Area Context
Price now trades beneath the floor of every nearby active balance (23,021, both 12-day and 26-day brackets), without a formal breakdown yet stamped — confirmation would open the pre-computed targets at 21,877/21,305 (12-day) and 20,777/19,654 (26-day).
Structural Zones
Overhead, a 223-point selling tail spans 22,857-23,080 — first supply on any rally, reinforced by Friday’s partially-filled tail to 23,163. Below, the nearest reference is a thin naked point of control near 22,640, untested since April — a plausible magnet if weakness continues.
Historical Statistics
The historical read is mixed, so size conviction accordingly. The tightest match — 7 sessions combining today’s exact IV regime, day type and open type — leans hard bearish (6 of 7 lower, avg -0.56% next day), but the sample is thin. The broader, more robust comparison (44 B-Shape-after-Open-Drive-Down instances) shows only a slight lean — 52% down vs. 39% up, edge score 0.24, near a coin flip — and a wider 455-session sample after any Open-Drive-Down open actually leans slightly bullish (51% up). Net: expect a wide range (historically 200-220+ points) but treat direction as a lean, not conviction.
Opening Playbook
Zone 1 (inside value, 22,780-22,880): default responsive, fading toward the 22,840 POC. Zone 2 (below value, inside range, 22,762-22,780): a dip into the small buying-tail pocket offers a tactical long back to the POC, invalidated under ~22,740. Zone 3 (above value, inside range, 22,880-23,080): a rally into the large selling tail is the higher-probability fade back to the POC, invalidated above 23,100. Zone 4 (below range, under 22,762): a confirmed break lower targets the naked POC near 22,640, with 21,877 in reach on a stretch, invalidated on a reclaim of 22,780. Zone 5 (above range, over 23,080): low-probability given the macro backdrop, but acceptance above the highs runs straight into Friday’s tail near 23,140-23,163 — trap warning, little room before real overhead supply.
Line in the Sand & Key Levels
LINE IN THE SAND: 22,880. Above it, bias shifts toward repair and two-sided trade back into today’s value; below it, sellers retain control and the path of least resistance points toward the naked POC near 22,640 and, if confirmed, the broken-balance targets near 21,900-21,300.
KEY LEVELS (high to low):
– 23,163 | Prior-day selling tail top | Overhead cap if today’s highs are reclaimed
– 23,080 | Today’s IB high / day high | First resistance on any rally
– 22,880 | Today’s VAH / naked TPO POC | Line in the sand
– 22,840 | Today’s POC | Fair-value pivot within today’s auction
– 22,780 | Today’s VAL (= today’s close) | Value/acceptance line
– 22,762 | Today’s day low | Undefended floor — no rejection tail
– 22,640 | Naked POC (April, 175 days untested) | Downside magnet if weakness extends
– 21,877 | 2x measured-move target, 12-day balance | Confirmation target if broken balance is stamped
Session Learning Note
Today is a reminder that sample size matters as much as how well a label fits: the tightest historical match (7 sessions) screamed bearish, while the broader, better-populated sample of the same basic pattern showed almost no edge at all. When a narrow analog and a deep one disagree, lean on the deep one for conviction and treat the narrow one as color, not a trade signal.