EXECUTIVE SUMMARY
- The market is in a short-term corrective phase, currently attempting to find acceptance within a multi-day balance area after breaking below it.
- Today’s session was a narrow-range Normal Variation day that gapped up but failed to sustain initiative buying, leaving behind a significant structural weakness in the form of a high VPOC, indicating trapped buyers.
- The primary scenario for tomorrow is continued balance and two-sided trade, with the 24220 POC acting as the line in the sand; acceptance above it targets repair, while failure targets a test of the gap support below 24173.
MACRO CONTEXT
The market is attempting to stabilize after a recent break of a multi-day balance structure. Today’s gap-up open brought price back inside the lower portion of a 6-day active balance area (24154.9 – 24431.6), but the session closed below this balance’s Value Area Low of 24268. This places the market in a precarious position: it has halted the immediate downside momentum but has not yet demonstrated the strength to reclaim value. The VWAP structure is mixed (D1 > Weekly > D3 > D2), reflecting the bounce but also the lack of clear directional control by Other Timeframe participants.
Day Type & Profile Shape
Today was a Normal Variation day characterized by significant range compression. The market gapped up and the Initial Balance (IB) broke to the upside, but there was very little follow-through from OTF buyers. The day’s range of just 80.6 points is a fraction of the prior day’s 147.2 points and well inside the 20-day ATR of 179.56. This sharp contraction in range, following a directional move, signals a pause and balance-seeking activity. The profile is narrow and poorly structured, with a close near the center, reinforcing the indecisive, two-sided nature of the auction.
Value Area & Acceptance
- Today’s TPO VA: 24200.0 (VAL) — 24220.0 (POC) — 24230.0 (VAH)
- Prior Day’s TPO VA: 24040.0 (VAL) — 24060.0 (POC) — 24080.0 (VAH)
The auction gapped up and established value entirely above the prior day’s value area. This value migration higher is structurally a positive sign, indicating OTF buyers were initially willing to transact at higher prices. However, the extremely narrow value area (30 points) and the failure to build on the opening gains suggest this acceptance was weak and tentative. The market did not do a good job of exploring higher prices after the initial gap.
POC vs Close Analysis
- TPO POC: 24220.0
- Volume POC: 24320.0
- Close: 24231.85
There is a significant 100-point divergence between the Volume POC (where most volume traded) and the TPO POC (where most time was spent). The market closed well below the VPOC but just above the TPOC. This is a critical and bearish structural footprint. It indicates that heavy volume was transacted at higher prices early in the day, but the market could not hold those levels and spent the majority of the session trading lower. This has likely trapped initiative buyers who participated at the day’s highs, and their positions could act as fuel for downside if key support levels fail.
Other Timeframe Assessment
OTF participation was mixed and ultimately lacked conviction. The session began with an Open Auction Out of Range (OAOR) to the upside, a sign of OTF initiative. The IB high was taken out early in C-period, which is typically a strong signal. However, the range extension was minimal, and the market quickly fell back into the IB range. A buying tail was formed at the low (24184.55), indicating some responsive buying interest. However, the failure to hold the highs and the prominent VPOC left far overhead suggest that sellers were more dominant as the session progressed. The auction was inefficient, leaving a poor structure that needs repair.
Volatility Regime
The volatility context is signaling a potential for a significant move. The IV regime has shifted from LOW to NORMAL, but realized volatility is decelerating, with the HV5d (7.2) well below the HV20d (9.4). Today’s range was a tight compression, just 0.45x the ATR.
Two key metrics point to coiled energy:
1. Rubber Band: The state is ‘COMPRESSED’, meaning recent intraday rotations have been 35% smaller than what the options market’s IV implies. Intraday price swings are unusually muted.
2. IV vs HV Spread: IV (8.5) is currently trading fairly relative to HV5d (7.2). Options are not pricing in a major volatility shock yet, but the underlying compression in realized volatility is notable.
The combination of a compressed rubber band and overall range contraction suggests the market is coiling. While standard MP levels should be reliable for now, traders must be prepared for a sharp range expansion event.
Dealer Positioning (Options Book)
WITHHELD [narrator_guard: dealer section withheld]. The generated dealer-positioning section failed the automated compliance check twice and was removed before storage. No dealer-book reading is offered for this session. The absence of this section is not a statement about the options book.
Balance Area Context
Price is currently trading inside the range of a 6-day active balance spanning from 24154.9 to 24431.6. However, the close at 24231.85 is below this balance’s Value Area Low (VAL) of 24268. This is a position of weakness. While the market has stopped the immediate fall, it is failing to find acceptance back inside the core value of the recent range. The immediate task for buyers is to reclaim this 24268 level. Failure to do so keeps the door open for a re-test of the balance low at 24154.9 and the downside extension targets from the previously broken 8-day balance, with the 2x target at 23438.95.
Structural Zones
ABOVE CURRENT PRICE (Resistance):
* 24230 – 24265.15 (VAH to Day High): First area of resistance. Contains the upper portion of today’s weak profile.
* 24268 (Balance VAL): The Value Area Low of the active 6-day balance. A critical level for buyers to reclaim to suggest repair.
* 24320 (Today’s VPOC): A high-significance resistance level representing trapped buyers from today’s session. Expect aggressive selling here on the first test.
* 24330 – 24340 (Naked POCs): Unrepaired POCs from Aug 17th, acting as magnets and potential resistance.
* 24392 (Balance VAH): The upper end of the 6-day balance value area.
BELOW CURRENT PRICE (Support):
* 24200 (Today’s VAL): The lower boundary of today’s narrow value area. First minor support.
* 24173 – 24225 (Gap Zone): Today’s unfilled gap up. The top of the gap is at 24173 (based on prior day high of 24172.85). This is the most significant near-term support zone.
* 24184.55 (Today’s Low): The session low and buying tail start here. A break below invalidates the responsive buying seen today.
* 24154.9 (Balance Low): The low of the active 6-day balance. A failure to hold the gap support puts this level in play.
* 24110 / 24060 (Prior Day POCs): Naked POCs from the previous session that could act as downside targets if the market breaks lower.
Historical Statistics (Relevance-Scored)
Statistical confluence points to a slight directional_lean for a bullish follow-through, but the edge is weak. Of 7 relevant historical analogs, 5 favor a bullish outcome, but the maximum edge score is only 0.38, which is not a high-conviction signal.
- The most relevant setup, ‘After NORMAL_VARIATION + OD_DOWN combo’ (n=160), has seen the next day close higher 52.5% of the time.
- Similarly, ‘After gap up (>0.3%)’ (n=456) has led to an up day 51.8% of the time.
These statistics suggest a slight upward bias but are close enough to a coin flip that they should not be the primary driver of a trade plan. The structural context, particularly the range compression and VPOC divergence, is more important.
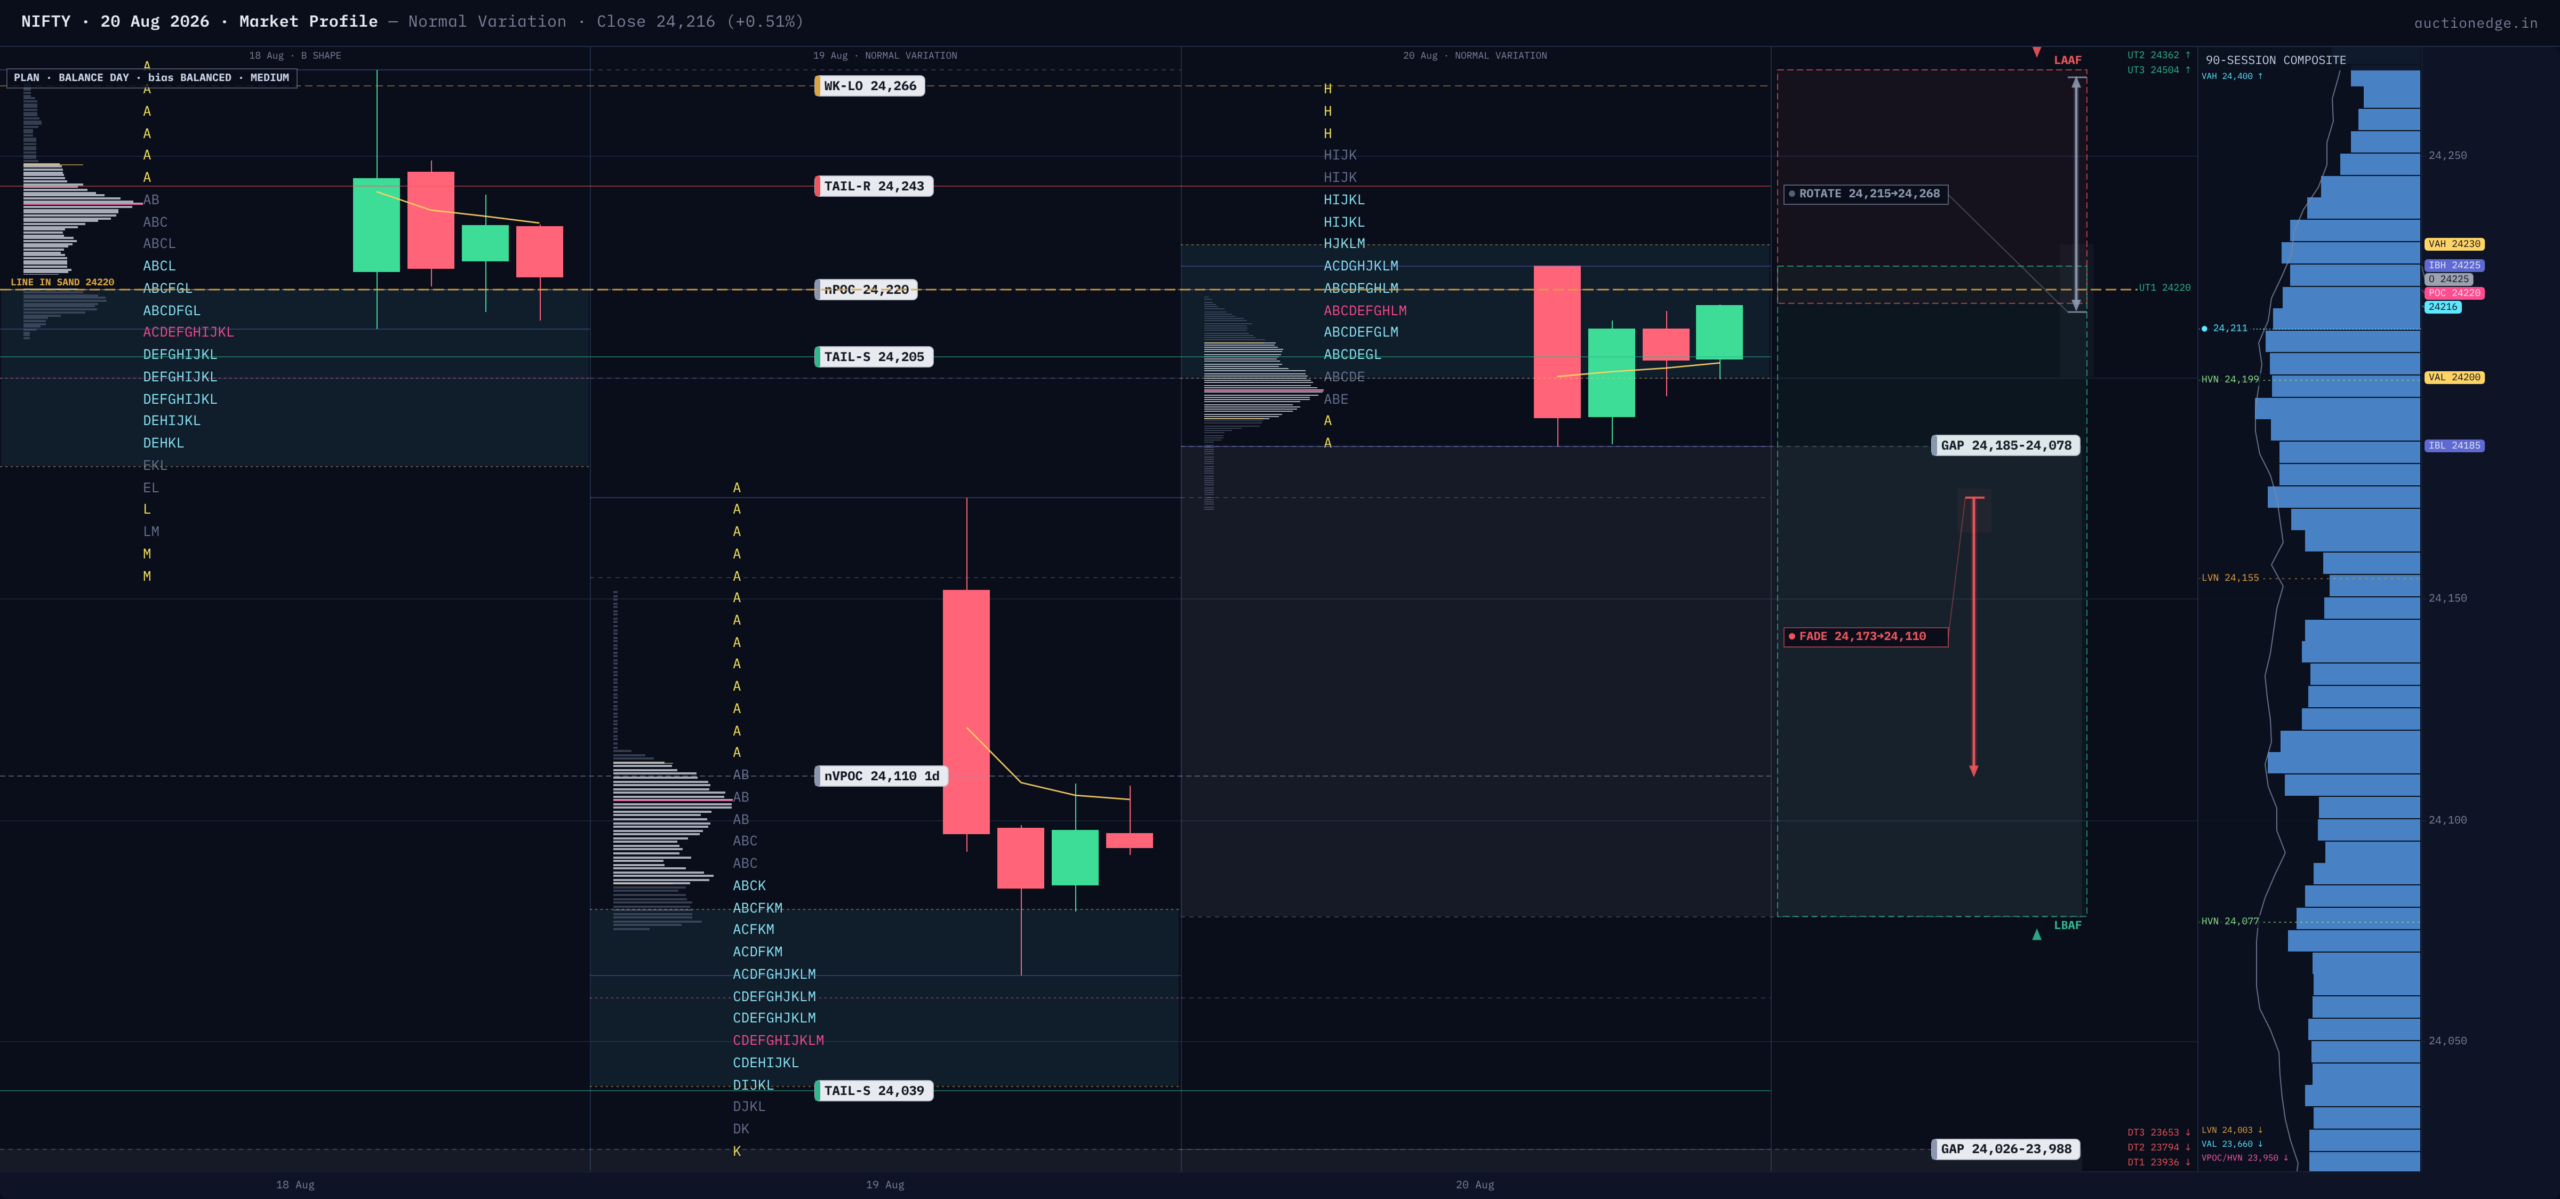
Opening Playbook
a) OPEN INSIDE VALUE (24200.0 to 24230.0):
This is a neutral open inside a weak balance. The expectation is for choppy, two-sided trade. The first test is of the VAH at 24230. Acceptance above targets the Day High at 24265 and the critical Balance VAL at 24268. Rejection from VAH targets the VAL at 24200. A break below VAL targets the gap top at 24173.
b) OPEN OUTSIDE VALUE BUT INSIDE RANGE:
* Below Value (24184.55 to 24200.0): An open here immediately tests the top of the gap support zone (24173-24225). Look for responsive buyers to defend this area. A long trade can be considered on a successful hold of 24185, targeting a rotation back to the POC at 24220. Failure to hold 24185 signals a full gap-fill attempt towards 24173.
* Above Value (24230.0 to 24265.15): This open is immediately challenging the Day High. The key test is the Balance VAL at 24268. An initiative move that clears 24268 on volume could target the trapped-buyer VPOC at 24320. A failure to clear 24268 would be a fade opportunity, targeting a rotation back to VAH at 24230.
c) OPEN BELOW RANGE (< 24184.55):
This is a gap down that immediately fills today’s gap up, a sign of weakness. The primary scenario is a test of the prior day’s high at 24173. If sellers show initiative and break 24173, the next major support is the Balance Low at 24154.9, followed by the naked POCs from the prior session around 24110.
d) OPEN ABOVE RANGE (> 24265.15):
This is a gap up that clears today’s high and the Balance VAL at 24268. This is a constructive open. The first target is the high-volume node of trapped buyers at 24320. TRAP WARNING: Expect significant resistance at 24320. A long on the gap up should have a primary target just below 24320. A sharp rejection from this level would offer a high-probability fade short, as trapped buyers may look to exit at break-even.
Line in the Sand & Key Levels
LINE IN THE SAND: 24220
“Above 24220 (today’s POC), buyers are attempting to repair the poor structure and can target higher references. Below 24220, sellers confirm control, and the path of least resistance is down towards the gap support at 24173.”
KEY LEVELS (ordered high to low):
* 24392.0 | Balance VAH | Upper boundary of the key 6-day balance.
* 24320.0 | Today’s VPOC | Major resistance, location of trapped buyers.
* 24268.0 | Balance VAL | Key pivot; reclaiming this is bullish, rejection is bearish.
* 24265.15 | Day High | Today’s high, first level of resistance.
* 24230.0 | Today’s VAH | Upper boundary of today’s narrow value.
* 24220.0 | Today’s POC | Line in the sand; fair value for the session.
* 24200.0 | Today’s VAL | Lower boundary of today’s value.
* 24184.55 | Day Low | Today’s low; break confirms weakness.
* 24173.0 | Gap Top | Top of today’s unfilled gap; major support.
* 24154.9 | Balance Low | Lower boundary of the 6-day balance.
Session Learning Note
Today’s auction was a classic example of how a gap up’s initial strength can be misleading. The market taught us that without sustained OTF participation and range extension, a gap up can create more problems than it solves. The significant divergence between the Volume POC (24320) and TPO POC (24220) is the day’s most important footprint, highlighting a large inventory of trapped buyers. This serves as a reminder that where volume is done is often more important than where time is spent, and such divergences create powerful future reference levels.